

Point Forecast API
Enterprise-grade weather intelligence for any coordinate on earth. Our API automatically selects the best forecast model for your location and time, delivering high-resolution data with the accuracy and reliability your applications demand.
Stop guessing which weather model to use. Our API automatically selects the best available forecast based on your specific location and time. Expert meteorologists configure the logic, so you always get the highest quality data without needing to be a meteorologist yourself.
Intelligent Model Orchestration
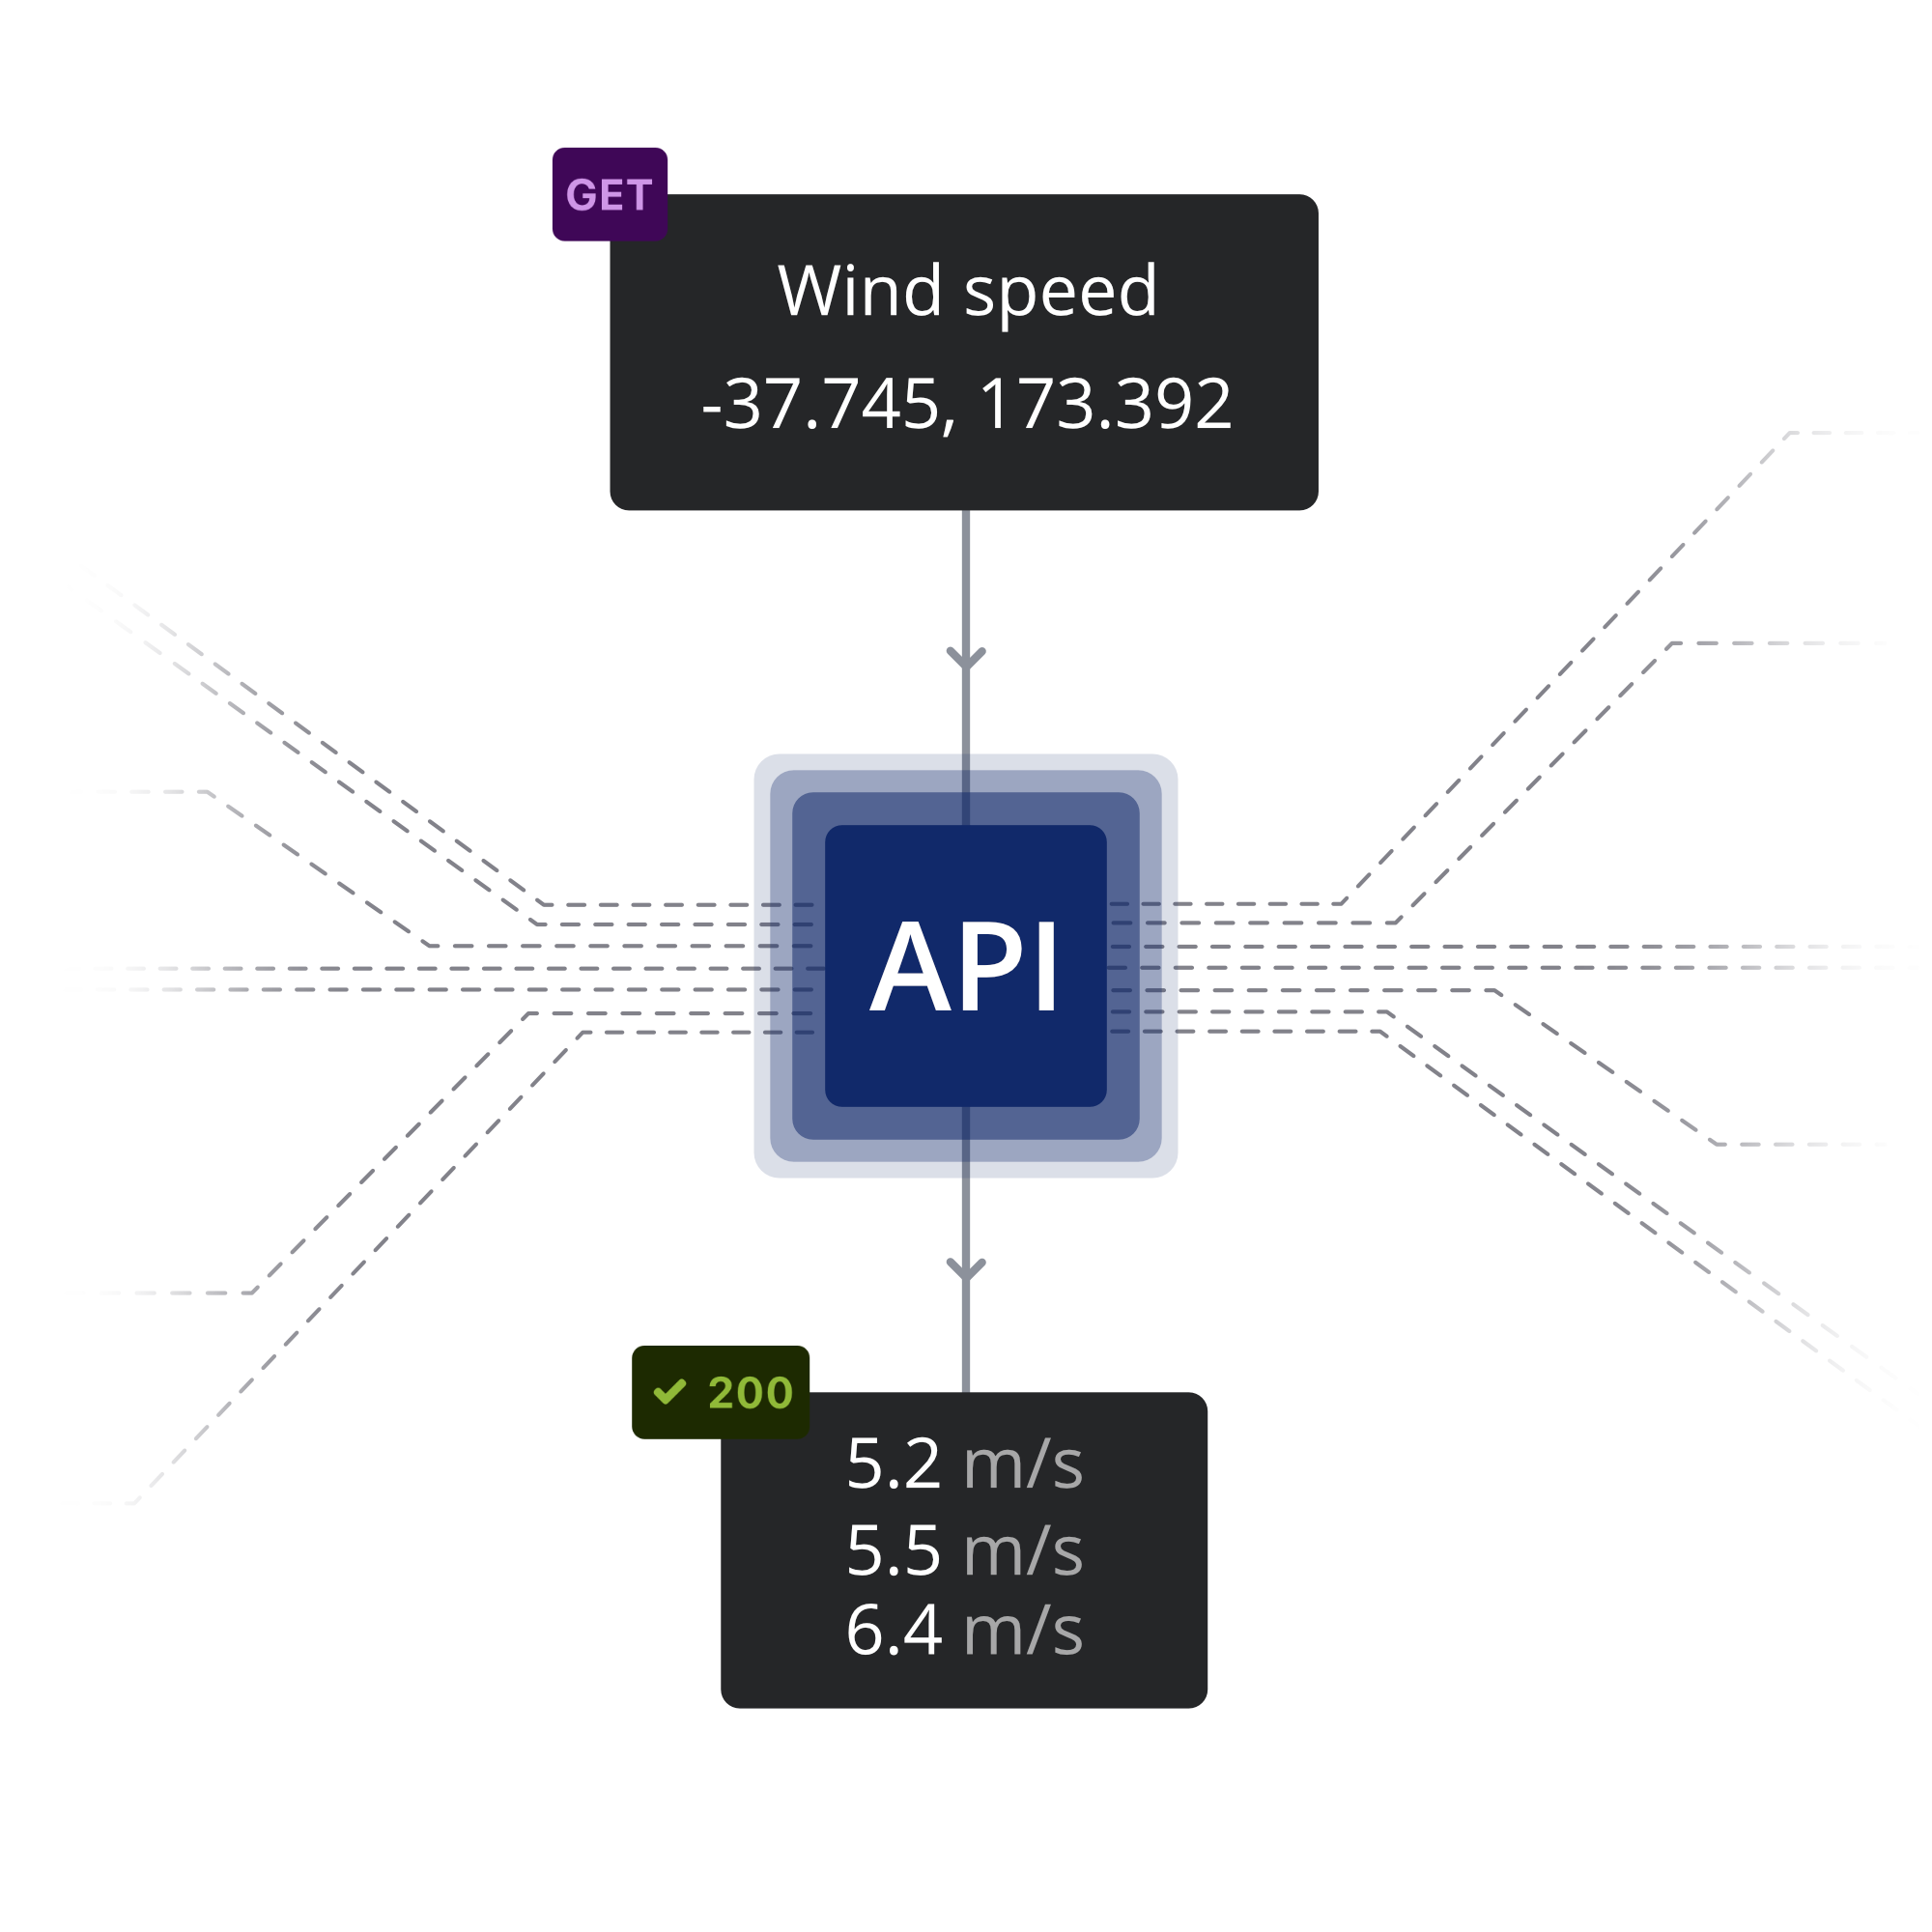
Get exactly the data you need. Request forecasts for any coordinate, route, or trajectory. Our system supports standard CF-compliant names and computes derived variables on-the-fly, eliminating complex post-processing so you can focus on building your application.
Flexible Data, Your Way
Instead of querying hundreds of individual points, get a single, cohesive forecast for an entire journey. Our dedicated route endpoints calculate weather conditions along moving paths, optimizing for safety and operational efficiency in a single request.
Route & Trajectory Forecasting
Your decisions depend on data integrity. Our "cycle locking" feature ensures all data comes from the same model run, preventing inconsistencies. This guarantees the precision and reliability required for safety-critical and scientific applications.
Enterprise-Grade Reliability


Access both atmospheric and oceanographic forecasts from a single API. Our team uniquely combines meteorologists and ocean scientists, a capability born from integrating MetOcean Solutions into MetService. Get comprehensive environmental intelligence for land, air, and sea applications, all through one unified interface.
Broad Environmental Intelligence
Built for Developers,
Powered by Science
We know handling the complexity of meteorology and large datasets can be challenging. Our API simplifies that complexity so you can focus on building great applications.
Authentication: API key (x-api-key header).
Protocol: HTTPS REST API.
OpenAPI 3.0 Specification: Full Swagger documentation available.
Python Client Library: Official Python SDK (
forecast-api-client).Historical forecasts: 5 days of recent forecast history included.
Flexible Response Formats: Support for standard JSON, Base64-encoded and CF-JSON (Climate and Forecast JSON).
Up to 10 Day Horizon
Forecast horizon
Hourly
Forecast frequency
Updated 4x Daily
Model run
Available Variables
Atmospheric
Wind speed gust
Air temperature
Air humidity
Air visibility
Air pressure (at sea level, low & middle cloud base)
Cloud cover
Cloud base
Wind speed
Gust speed
Ocean
Current speed (at sea surface, barotropic)
Sea depth
Sea temperature (at sea surface)
Wave direction (mean, peak, directional spread)
Wave period (Peak, first & second frequency and above/below 8s peak)
Wave height (total & above/below 8s)
Specialty
Atmosphere convective potential energy
Precipitation flux
Radiation longwave flux downward
Radiation shortwave flux downward
Find Your Perfect Plan
Start building today! Explore the power of our Weather API risk-free with our free tier.

Basic
$30 USD
For small teams or induvial professionals.
per month
Additional Key features:
Commercial use
Additional API units available
Included API units: 100,000
$0.04 per additional

Plus
$75 USD
For small teams or individual professionals.
per month
Additional Key features:
High resolution 4km NZ WRF models
Included API units: 1,500,000
$0.02 per additional

Pro
$500 USD
For those seeking a complete selection of data and support.
per month
Additional Key features:
Forecast data from multiple models
Up to 10 day forecast horizon
5 days of historical forecasts
Included API units: 250,000
$0.03 per additional
Enterprise
Transform your operations with a tailor-made solution. We can create custom weather models for the areas you care about and provide priority support.
*Prices in USD
Feature & Plan Comparison
Custom models & domain
$0.02
Email & Phone
Enterprise
Starter
Custom
Basic
Plus
Pro
API units (Monthly)
50,000
100,000
250,000
1,500,000
Additional units (Per 100)
$0.04
$0.03
$0.02
Commercial use
Global models
High resolution regional models
Support (NZ business hours)
Email & Phone
Contains all the options include in the Pro plan with further options like custom models, domains and flexibility around API units.
Enterprise
Tiering indicative only and subject to change, terms & conditions
FAQs
-
This is the measure by which you are charged for the API service. It is made up of requests x variables x points.
variable: wave.height x point = 1 API units
variables: (air.temperature.at-2m, cloud.cover) x point = 2 API units
variables: (wave.height, air.temperature.at-2m, cloud.cover) x 2 points = 6 API units
You receive a base number of API units based on your subscription plan, after these base units have been used you are then charged for each additional API unit (in lots of 100) up to the absolute limit you set in the "USAGE & KEYS" section of your account, found in the console.
Derived variables (calculated from other variables) don't count as units themselves, but you are charged for the underlying input variables required to calculate them. For example, requesting wind.speed charges for 2 units (the u and v components).
-
A full break down of the individual models available in each plan can be found once logged into the API Console
-
Our API doesn't just serve a single forecast model. It automatically selects the best available model for your specific location based on a multi-factor ranking system configured by our expert meteorologists. The system prioritizes models with:
Higher priority - Set by forecasters based on model reliability
Finer spatial resolution - Smaller domains with more detailed local coverage
Better temporal resolution - More frequent forecast updates
For requests covering multiple time periods, the API can seamlessly join data from multiple models to give you the best coverage across your entire forecast horizon.
-
Yes, you can use the Starter plan for prototyping, testing, and building a proof of concept. However, once your integration is live or used in a production environment, you must upgrade to at least the Basic plan ($30/month) to ensure compliance with our commercial use terms.
-
Cycle locking ensures all data in your response comes from the same model run. Without this, you could get data from different forecast cycles that might be inconsistent with each other, for example, temperature from the 6am run and wind from the 12pm run. This feature is critical for scientific applications and safety-critical decision-making where data integrity is paramount.
-
All plans include 5 days of historical forecast data for validation, analysis or recovery. If you need long-term historical archives or hindcast data for research or modeling purposes, please contact our sales team at nzsales@metservice.com to discuss custom solutions.
-
Route forecasting is designed for applications where the location changes over time, like ships, aircraft, or delivery vehicles. You provide a series of waypoints with times (or a path with speed/direction), and we calculate the weather conditions along that entire journey. This is far more efficient than querying hundreds of individual points and ensures you get a cohesive forecast for the entire route.
-
Starter: API access will be paused until the next billing cycle
Paid Plans: Overage charges apply automatically at the rates shown above, or you can upgrade to the next tier for better value
A custom limit can be set in the API Console
-
Yes, you can upgrade your subscription at any time. Your currently subscription will be cancelled, and you will be charged the full price for the new plan, not considering the remaining time in your billing cycle. Your billing cycle and renewal date will change.
-
No, you will be charged only for the amount used. The cap will prevent accidental excessive charges (maximum to be used/charged will be the limit set).
-
MetOcean was acquired by MetService in 2013. This API wasn’t part of the original technology migration but we plan to do so in future.
Have any further questions, contact our helpful team.